World Development Indicators Presentation
Inflation Rate Distribution
- The histogram shows the distribution of inflation rates across different countries.
- Most countries have low inflation rates, but a few outliers show exceptionally high rates.
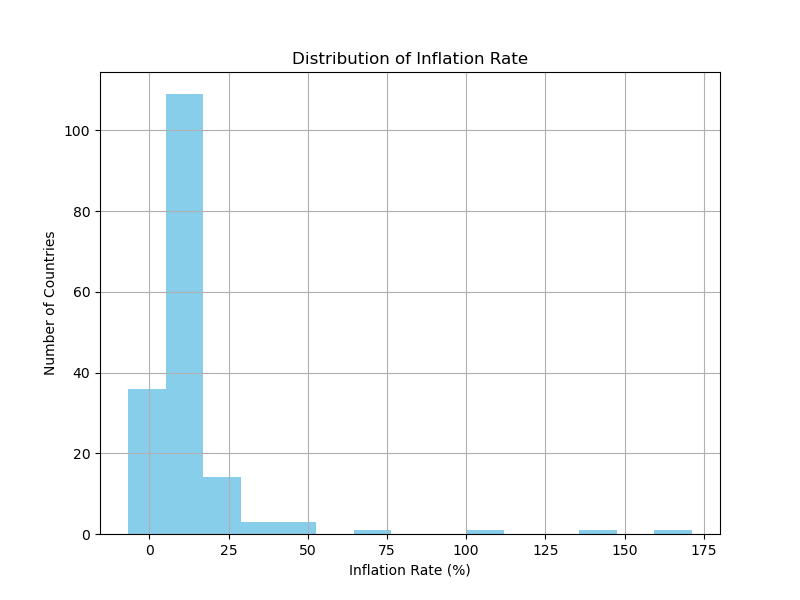
Distribution of Inflation Rate
GDP Growth Rate Distribution
- The histogram shows a more balanced distribution for GDP growth rates.
- Most countries have moderate growth rates, while a few show rapid growth.
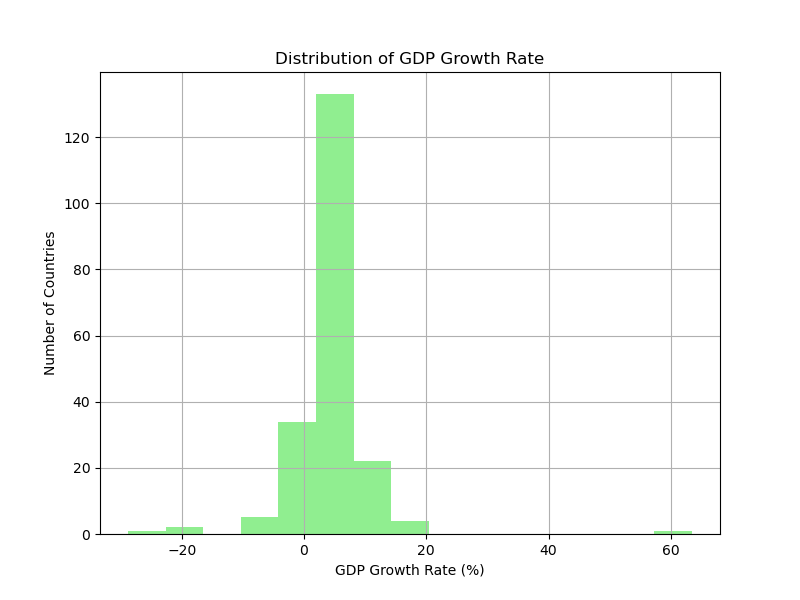
Distribution of GDP Growth Rate
Life Expectancy Distribution
- The life expectancy histogram shows that most countries have life expectancies around 70-80 years.
- This indicates improvements in healthcare globally.
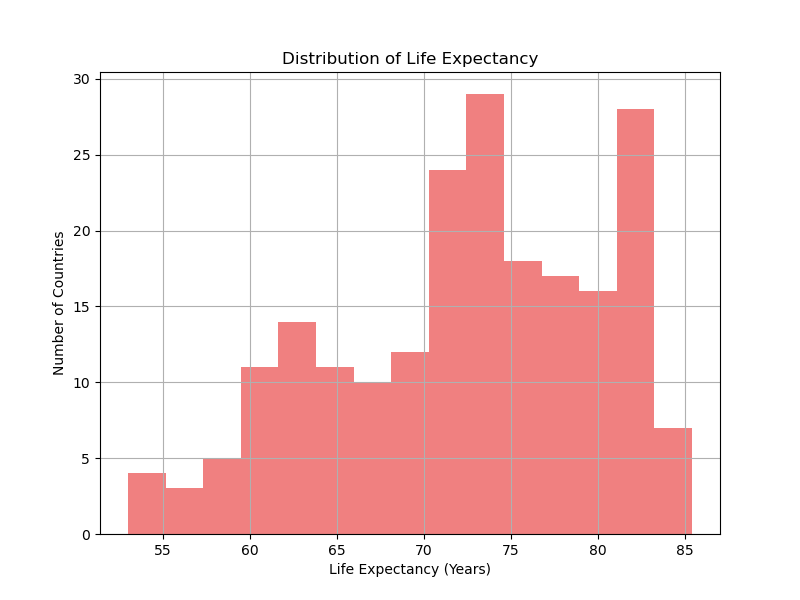
Distribution of Life Expectancy
Life Expectancy vs GDP Growth Rate
- Higher life expectancy is often linked to healthier workforces and stronger economies.
- The scatter plot below visualizes the relationship between life expectancy and GDP growth rate.
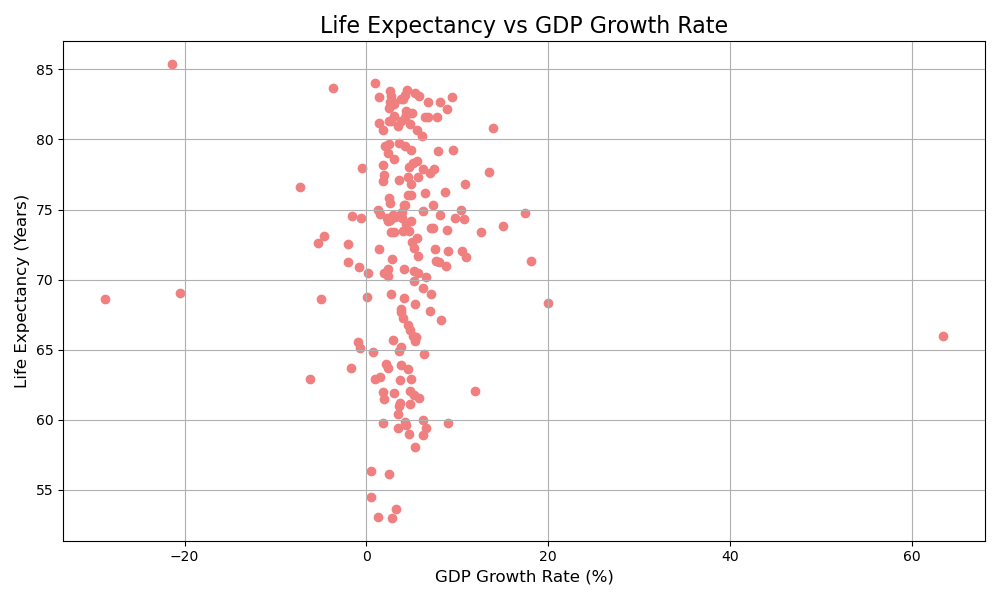
Life Expectancy vs GDP Growth Rate
Fastest Growing Countries by GDP
- The bar chart shows the top 10 countries with the highest GDP growth rates.
- These nations may offer opportunities for investment and development.
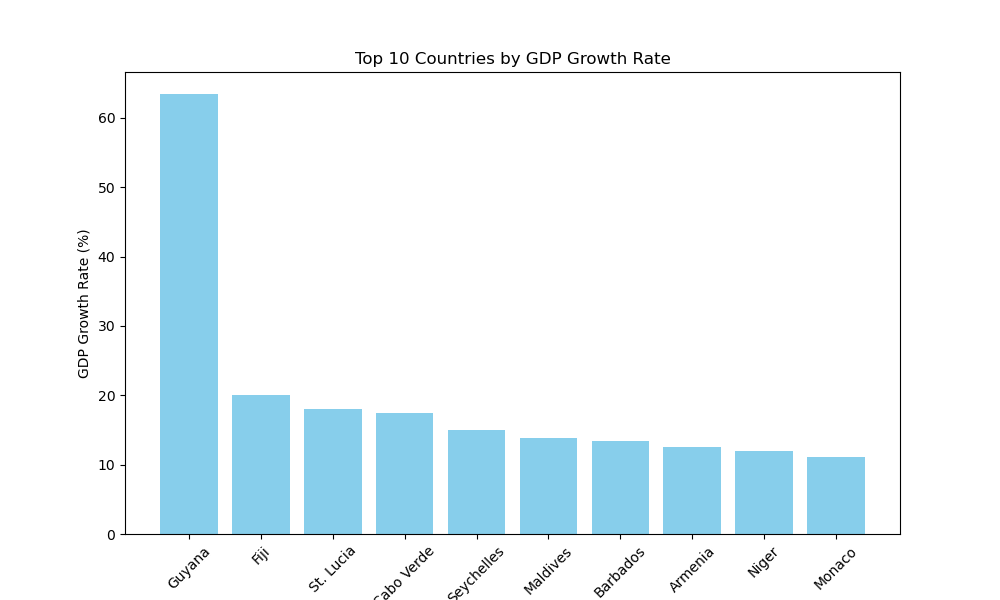
Top 10 Countries by GDP Growth Rate